Recent Posts
The Coming Hyperinflation of Australian Property
Posted by on
The Coming Hyperinflation of Australian Property
The COVID-19 pandemic has caused significant political, economic and social changes during the course of 2020 and 2021, among them being to the Australian and global economies.
As noted in the April 2020 article Australia has been economically destroyed within 4 weeks[1], the Australian policy establishment in response to the COVID-19 pandemic unleashed the largest fiscal and monetary policy stimulus package in Australian history.
This policy response was in large part an attempt to prevent Australia’s record household debt bubble from collapsing as a result of escalating delinquencies and defaults, which would have occurred resulting from:
- the general global decline in economic activity resulting from a collapse in economic confidence and international supply chain disruptions; and
- specific Australian COVID-19 restrictions including the policy of lockdown
in the absence of economic stimulus.
This consequently would have led to the collapse of Australia’s banking and financial system when delinquencies and defaults reached critical mass, thus resulting in Australia experiencing the largest economic depression since 1892.
Nevertheless, the unleashing of this Australian policy response, which coincided with other foreign government and central banks who implemented similar policy responses, led to the manifestation of stagflation in 2020[2] and then subsequently ‘accelerated stagflation’ in 2021[3].
In the Australian context, this manifested itself particularly in sharp rises in the prices of property and, to a lesser extent, financial assets such as shares and crypto currencies.
This latter point can be demonstrated by analysing the growth in capital city property price indices as published by CoreLogic. Table 1 shows the growth in Australian capital city property prices from 1 January 2020 to 24 January 2022.
Table 1: Growth in Australian Capital City Property Prices – Core Logic
| Sydney | Melbourne | Brisbane | Adelaide | Perth | 5 Capital City | |
| 01/01/2020 | 166.75 | 153.56 | 108.96 | 116.85 | 85.86 | 140.88 |
| 24/01/2022 | 215.94 | 174.62 | 149 | 154.95 | 106 | 174.52 |
| % Increase | 29.5% | 13.7% | 36.7% | 32.6% | 23.5% | 23.9% |
As demonstrated by Table 1, the extraordinary economic stimulus related to the COVID-19 led to an average increase of approximately 24% across Australia’s five capital cities.
Further granular analysis (as has been conducted by property analysts such as Martin North of Digital Finance Analytics (DFA))[4] of the Australian property market demonstrates that growth:
- in house prices materially outstripped movements in the price of apartments; and
- regional city property prices outstripped property prices in capital cities.
Impact of Australian Monetary Policy
Within the Australian context, the bottom-line effect of extraordinary economic stimulus has been stagflation and accelerated stagflation via the evermore expansion of credit and accumulation of debt by both Australian households and businesses (especially households).
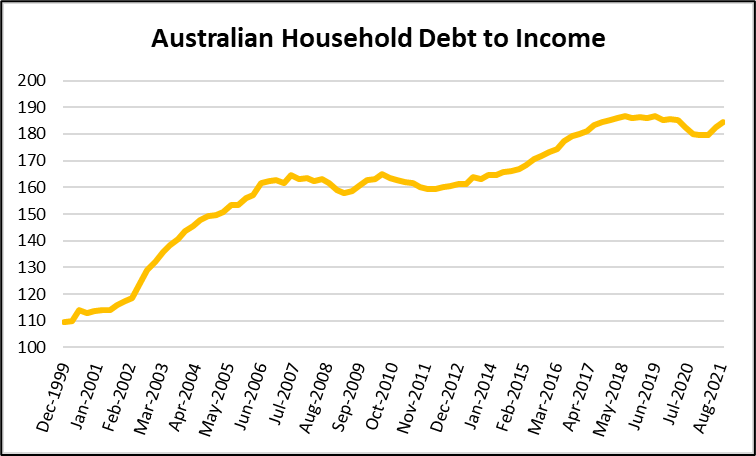
For example, as illustrated in Diagram 1, data from the Reserve Bank of Australia (RBA) shows that the economic turmoil resulting from COVID-19 in 2020 led to a sharp fall in the Australian household debt to income ratio from 186.7 to 179.5, however extraordinary fiscal and monetary policy measures led to a sharp rise (claw-back) in the Australian household debt to income ratio to 184.6 by September 2021.
Diagram 1: Australian Household Debt to Income
Importantly this data:
- includes unincorporated small-to-medium businesses (SMEs); and
- does not include buy-now, pay-later financial products which have not been deemed as ‘credit’, but have been embraced by a significant number of Australian consumers.
Extraordinary monetary policy measures such as:
- lowering the RBA’s official cash rate to 0.1% and the interest rate payable to exchange settlement accounts (i.e., commercial bank reserves held at the RBA) to 0%;
- quantitative easing (QE) – centred on RBA purchases of Australian and State/Territory government bonds (irrespective of the yield);
- Yield Curve Control (YCC) – artificially controlling the yield of Australian Government bonds of terms out to and including April 2024 to only 0.1%; and
- the provision of the Term Funding Facility which by June 2021 amounted to $AUD 188 billion of funding to Australia’s commercial banks over 3 years to mid-2024 at 0.1%
have also led to interest costs faced by Australian households falling to their lowest levels on record (the RBA data series started in March 2017).
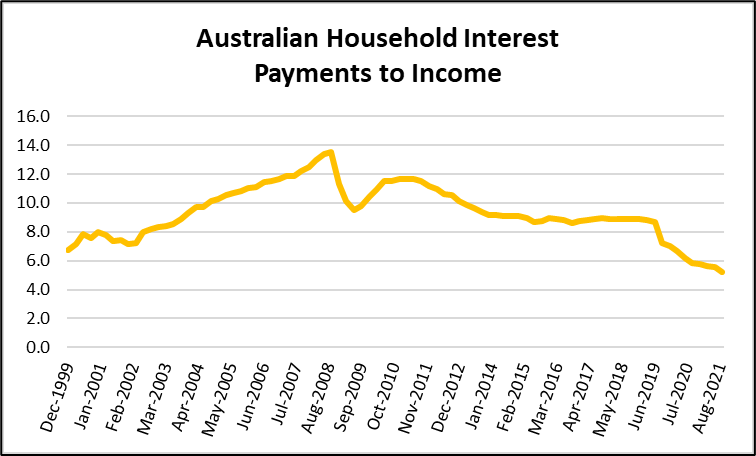
This can be shown in Diagram 2, which shows the ratio of Australian household interest payments to income being at its lowest level since the start of the sharp rise in household debt and property prices in the late 1990s at just 5.2% for September 2021.
Diagram 2: Australian Household Interest Payments to Income
Extraordinary monetary policy measures in Australia can also be seen in the sharp rise in annualised credit growth for housing which is demonstrated in Diagram 3.
Diagram 3: Australian Credit - 12-Month Housing Growth
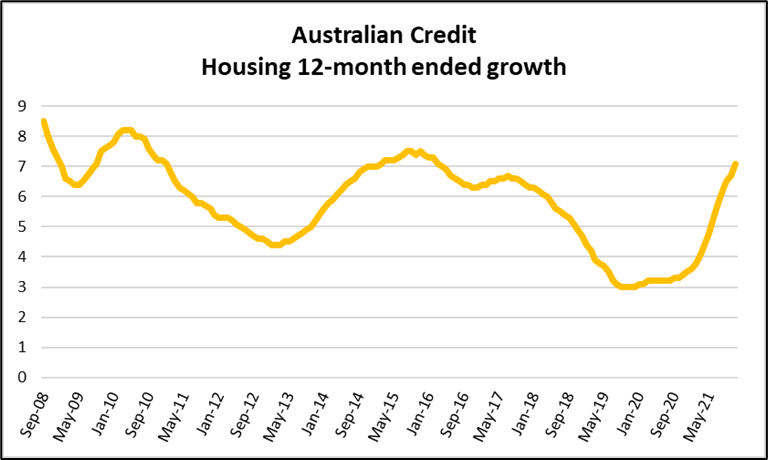
In Diagram 3, annualised credit growth can be seen growing from 3% in September 2019 to 7.1% in November 2021, the highest rate of annualised credit growth since March 2016. The bulk of this growth was seen among those owner-occupier borrowers (as shown in Diagram 4) as opposed to real‑estate investor borrowers (as in Diagram 5).
Diagram 4: Australian Credit – 12-month Owner Occupier Growth
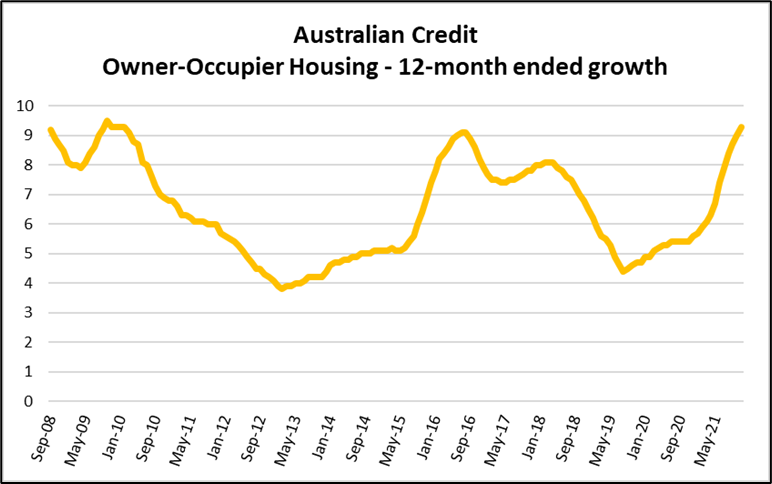
Diagram 4 shows annualised credit growth among owner-occupiers grew to 9.3% in November 2021, up from the low of 4.4% in August 2019. The rate of annualised credit growth among owner‑occupiers was the highest since February 2010.
Diagram 5: Australian Credit - 12-month Investor Housing Growth
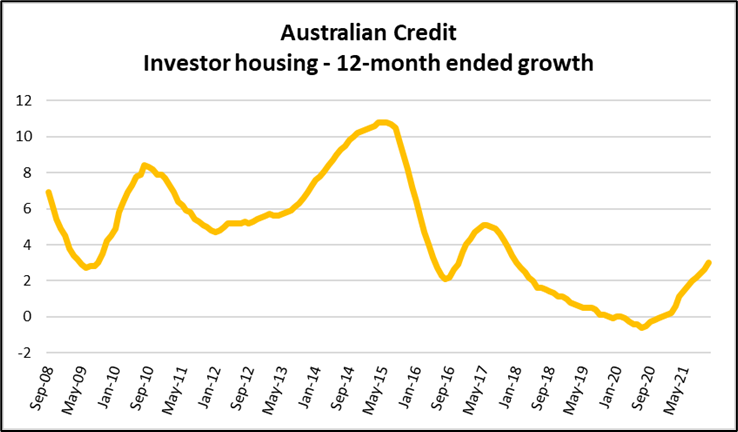
Diagram 5 shows annualised credit growth among investors grew to 3% in November 2021, up from the low of -0.6% in July 2020. The rate of annualised credit growth among investors was the highest since January 2018.
It is important to note that this phenomenon is not purely a function of extraordinary macroeconomic stimulus, but is also partly a function of Australia’s strict COVID-19 immigration policy.
As outlined in the published July 2021 article, The Radical COVID-19 transformation of the Australian Labour Market[5], Australia experienced a net outflow of particularly young immigrants (both visitors and residents) from February 2020 to June 2021 leading to both middle aged (35-44 years old) and older Australians (55 years+) both re-entering the labour force as well as securing both part and full‑time work.
This, according to the Australian Bureau of Statistics (ABS), lead to a fall in Australia’s unemployment rate (as measured by the ‘original’ series) from 5.7% in January 2020 to 4.8% in June 2021 to only 4.0% in December 2021.
Nevertheless, what is concerning is that the significant growth in property prices (as well as credit issued and debt accumulated) during the COVID-19 pandemic has also resulted in an even greater concentration of lending by Australian ADIs to Australian households (i.e., the non-government and non-business sectors) as shown in Diagram 6.
According to data from the RBA, November 2021 saw that 58.7% of total lending issued by Australian ADIs was lent to Australian households, the highest recorded in the data series dating back to 1990.
Diagram 6: The percentage of Australian Bank Lending to Persons
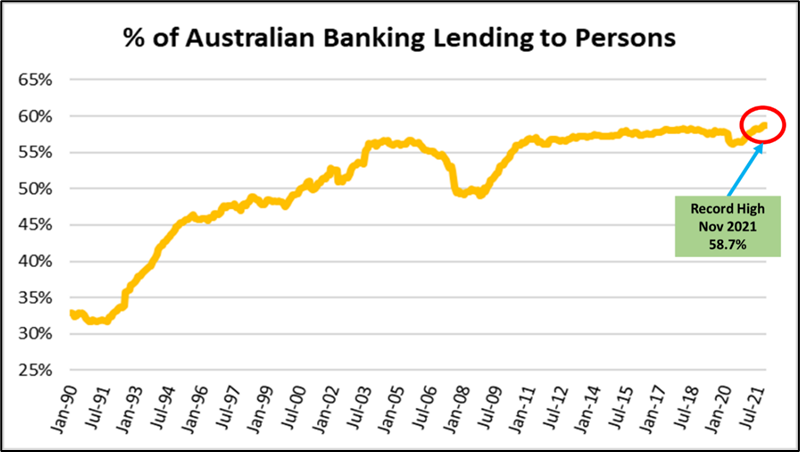
It is important to note that if both unincorporated and incorporated SMEs that have been capitalised by household borrowing (such as mortgages) is also taken into account, then the percentage of ADI lending to Australians household would be higher than the recorded 58.7% as noted in Diagram 6 above.
Australian Household Mortgage Stress
Disturbingly, the COVID-19 pandemic and its related drastic policy measures such as lockdowns and border closures (both domestic and international) have resulted in a sharp and sustained increase in financial stress including both mortgage stress and rental stress, despite the provision of extraordinary stimulus and the decline in unemployment (particularly for older Australians).
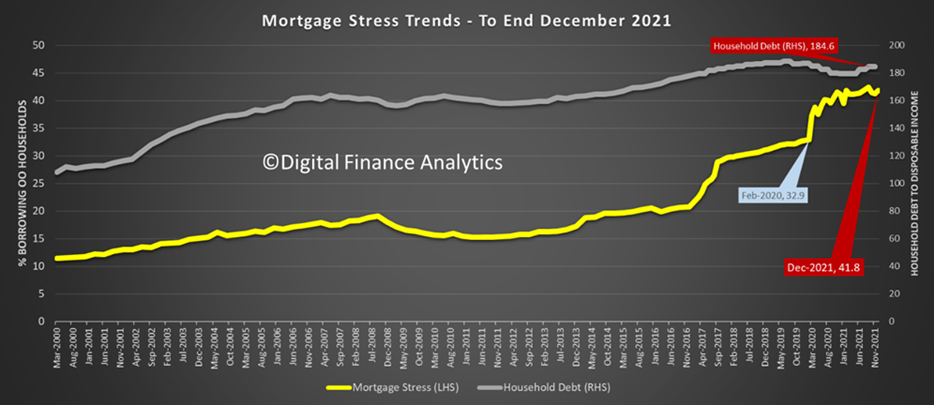
As noted in Diagram 7, data from DFA shows that Australian mortgage stress rose sharply from 32.7% in December 2019 to peak at 42.4% in September 2021 and has now fallen to 41.8% in December 2021.
Moreover, despite a temporary decline in rental stress during 2020 from approximately 40%[6] in April 2020 to 34.8% in October 2020[7] resulting from direct stimulus payments and rent relief during the COVID-19 lockdown, rental stress according to DFA has risen back to 40.53% as of December 2021[8].
Despite falling interest costs as noted above, rising mortgage and rental stress is a function of stagflationary forces such as:
- lower disposable income resulting from COVID-19 related restrictions (notably in specific affected sectors);
- larger mortgages driven by the psychological phenomenon of the Fear of Missing Out (FOMO) which in part triggered higher property prices;
- higher household living costs from items such as basic groceries, utilities, insurance, transport (fuel) and childcare; and
- negative real wages growth (i.e., nominal wages growth lower than inflation).
Diagram 7: Australian Mortgage Stress (Digital Finance Analytics)
Normalisation of Monetary Policy?
Both globally as well as for Australia, rising inflation resulting from extraordinary fiscal and monetary stimulus during the COVID-19 response has led to:
- some central banks tightening monetary policy such as Brazil[9], New Zealand[10] and Russia[11]; and
- added speculation that other central banks would normalise monetary policy by curtailing or ending quantitative easing programs as well as raising official cash rates – especially given that officially recorded inflation has proven to be persistent and not just transitory.
This latter point is particularly pertinent to the United States, given that annualised inflation for 2021 there reached 7% according to the US Bureau of Labor Statistics’ (BLS’) Consumer Price Index[12] (CPI) and 9.7% according to the BLS’ Producer Price Index[13].
This latter point also has relevance in the Australian context given that inflationary pressure here has also proved to be persistent in 2021 as measured by the ABS’ CPI outlined in Table 2.
Table 2: Quarterly and Annualised Australian Official Inflation (Australian Bureau of Statistics)
| Quarterly Inflation Rate | Annualised Inflation Rate | |
| March Qtr 2020 | 0.3% | 2.2% |
| June Qtr 2020 | -1.9% | -0.3% |
| September Qtr 2020 | 0.9% | 0.9% |
| December Qtr 2020 | 0.9% | 0.9% |
| March Qtr 2021 | 0.6% | 1.1% |
| June Qtr 2021 | 0.8% | 3.8% |
| September Qtr 2021 | 0.8% | 3.0% |
| December Qtr 2021 | 1.3% | 3.5% |
For now, the RBA Board through its February 2022 monetary policy announcement has indicated that its bond buying QE program will end on 10 February 2022[14].
The RBA Board has further indicated that underlying inflation (as measured by the ABS’ CPI) will need to be comfortably within the 2% - 3% range for consecutive quarters after the ending of the QE program prior to the official cash rate being lifted from the current 0.1%.
Importantly, the full normalisation of Australia’s immigration policy to a pre-pandemic posture will, if it eventuates, likely dampen (currently emerging) wages growth through reversing the transformation of the labour market as noted above via expanding labour supply.
The extent of this phenomenon in 2022 may delay any normalisation policy implemented by the RBA board.
Policy Normalisation Limitations?
Despite this latter factor, if the RBA’s forward policy guidance is to be believed it signals that the process of monetary policy normalisation in Australia still has some time to play out.
However, the more important point to note is that given the sharp rise in household indebtedness as well as mortgage and rental stress during the COVID-19 pandemic means that the scope for monetary policy normalisation is limited.
Any moves to normalised monetary policy would, while slowing the rate of inflation, lead to:
- increased financial stress among highly indebted households;
- slower credit growth resulting from higher costs in borrowing financial capital; and
- a reversed wealth effect through lower asset prices such as real estate and financial assets, leading to lower levels of household consumption and confidence.
The combination of these effects would be lower rates of economic growth and higher rates of unemployment that could potentially manifest into a downward-spiralling deflationary cycle. This phenomenon would, if allowed to advance unabated, threaten:
- the current valuation of Australian real estate;
- the solvency of Australian households resulting from falling disposable income and rising delinquencies; and
- the stability of Australia’s financial system and by extension the Australian macroeconomy (especially given the concentration of Australian bank lending to the household sector) if a critical mass of households were to default on their debt and interest repayment obligations.
Importantly, given the scale of Australia’s household debt bubble, a combination of these effects would have the potential to manifest into the largest economic depression in Australian history in the absence of policy interventions.
Such an economic depression would threaten the current stranglehold of political, financial and social power by Australia’s ruling establishment including:
- Australia’s parliamentarians (i.e., the political elite);
- Australia’s economic institutions (i.e., Treasury, RBA and the Australian Prudential Regulation Authority (APRA) – the bureaucratic elite); and
- Australia’s major banks (i.e., the banking/financial elite).
Thus, it is primarily the consequences to existing political, economic and institutional power which places a natural limitation as to the pace and extent to which Australian monetary policy can be normalised.
Such considerations are also relevant for other nations who have both:
- extraordinarily accommodative fiscal and monetary policy settings; and
- materially significant amounts of households, corporate or public sector (government) debt.
APRA – Zero and Negative Nominal Interest Rates
Importantly, while ordinary Australians were distracted in 2021 with COVID-19 lockdown restrictions and related vaccine mandates, APRA on behalf of the Australian Government was quietly putting in place the policy and operational foundations for zero or negative nominal interest rates (NNIRs) to be implemented in Australia.
For example, in December 2020, APRA:
“…wrote to all regulated entities regarding their preparedness for zero and negative interest rates and requested entities with material readiness issues to advise the nature of the issues and the timeframes for rectification/mitigation.“[15]
Moreover, in July 2021, APRA initiated a consultation process with Australian Deposit-taking Institutions (ADI) in relation to the regulator’s draft expectations for zero and NNIRs[16].
In its communications to Australian ADIs, APRA stated that zero and NNIRs were a possibility either directly through official policy set by the RBA or through pricing by financial markets. APRA indicated that Australian ADIs needed implementable tactical solutions if these events were to occur.
This consultation process was followed up with operational guidance outlining APRA’s final expectations, which was published on 28 October 2021[17]. Among APRA’s final expectations is the expectation that:
- ADIs will develop tactical solutions by 31 July 2022 for customer accounts in excess of $AUD 10 million; and
- such solutions can be implemented within 3 months if required (i.e., by the end of October 2022).
The foreshadowing of NNIRs in Australia is a significant development from both an economic and public policy perspective. It marks an important new sign post as to the likely direction of monetary and prudential policy in Australia over the coming medium term, irrespective of whether Australia experiences an external economic shock such as a new global financial crisis.
The introduction of a negative nominal official cash rate in Australia, based on international experience, does not necessarily mean that retail banking products will also yield a NNIR. But it does mean that retail banking products such as mortgages will likely charge retail borrowers a lower rate of interest than what current policy settings allow.
In practicable terms, given that Australian variable and fixed mortgage rates in 2021 were in the range of 1.8% - 2.4%, the introduction of NNIRs, especially by the RBA Board in the context of the official policy rate, is likely to result in Australian ADIs offering mortgage rates well below this range.
Conclusion
The COVID-19 pandemic has caused significant political, health, economic and social disruption to Australia and the world-at-large.
To prevent Australia’s record debt bubble from collapse, Australian policy makers unleashed the largest economic (particularly fiscal and monetary) policy stimulus package ever in Australian history. This, coupled with extraordinary economic stimulus around the world, led to the manifestation of acute inflationary pressure via stagflation.
Within the Australian context, rapidly growing household debt levels - through the expansion of household credit - has led to both a sharp rise in property prices and residential rents as well as financial stress, in particular mortgage and rental stress.
Any attempt to combat stagflationary forces through forward policy guidance and monetary policy normalisation has only limited scope, given the potential that such action would likely to an uncontrollable downward deflationary spiral and threaten the stability of Australia’s financial and banking system, risking Australia plunging into our largest economic depression since 1892.
Given the limited scope, tokenistic policy normalisation manoeuvres in Australia are likely in 2022 and 2023 which could include (among other measures):
- the ending of the RBA’s QE (or bond buying) program; and
- a modest lift in the RBA official cash rate which, however, will likely remain lower than the pre‑pandemic official cash rate of 1.5%.
But once these tokenistic manoeuvres dampen economic activity (especially via lower credit growth and consumption) and lead to higher unemployment (noting that Australia’s international borders are likely to reopen back to pre-pandemic levels in 2022 which will lead to higher overall labour supply and thus higher unemployment among older Australians and slow wage growth), the RBA will inevitably begin another gradual loosening monetary policy campaign potentially as early as 2024.
In a debt-driven economic growth model, this campaign will require levels of economic stimulus beyond current levels which is very likely to encompass NNIRs. In such circumstances, retail mortgage (and other debt product) lending rates – both variable and fixed - are likely to be lower than during the 2020 and 2021 COVID-19 pandemic.
Alternatively, if a major external economic shock were to occur any time from January 2022 onwards, Australian policy makers would, in order to prevent an economic depression, have little/no choice but to adopt extreme macroeconomic policy measures in rapid fashion. These are likely to include even deeper NNIRs and thus even lower mortgage (and other debt product) interest rates.
Thus, in both of these circumstances, lower mortgage rates (say at 1%) will increase the capacity of Australian households to borrow even greater levels of credit on a short-term myopic cashflow basis. It will thus likely send Australian property prices and associated rents to even higher stratospheric levels.
This process of stagflation and ultimately hyperinflation can and will continue to manifest until economic policy makers make a conscious decision to embrace deflationism (i.e., tight fiscal and monetary policy or resetting the currency by either introducing a new revalued currency or backing the existing currency to something of tangible value say physical gold (i.e., the gold standard)).
This ultimately means consciously risking the collapse of the financial system and thus the existing Australian and international political and financial power establishment structure.
No evidence is available that suggests that Australia’s political and financial power establishment structure have either kamikaze or suicidal tendencies and thus hyperinflation of Australian property over the medium term remains the most likely central scenario.
John Adams is the Chief Economist for As Good As Gold Australia
[1] https://www.adamseconomics.com/post/australia-has-been-economically-destroyed-within-4-weeks
[2] https://www.adamseconomics.com/post/can-central-banks-save-the-largest-debt-bubble-in-world-history
[3] https://www.adamseconomics.com/post/accelerated-stagflation-now-in-full-swing
[4] Watch the Walk the World YouTube video, The Property Predictions Crystal Ball is Cloudy: https://www.youtube.com/watch?v=jQuVIi3S57I
[5] https://www.adamseconomics.com/post/the-radical-covid-19-transformation-of-the-australian-labour-market
[6] https://www.youtube.com/watch?v=CIi2ayGjyeM
[7] https://www.youtube.com/watch?v=_I_vtMZhzl0
[8] https://www.youtube.com/watch?v=AMeYA4THkMg
[9] https://www.reuters.com/world/americas/brazil-central-bank-makes-150-bps-interest-rate-hike-despite-recession-2021-12-08/
[10] https://www.abc.net.au/news/2021-11-24/rbnz-rba-interest-rates-hike-house-prices-wages-employment-banks/100646272
[11] https://www.reuters.com/markets/europe/russia-raises-key-rate-sharply-85-its-highest-since-2017-2021-12-17/
[12] https://www.reuters.com/world/us/us-consumer-prices-increase-strongly-december-2022-01-12/
[13] https://www.reuters.com/business/us-producer-prices-exceed-expectations-november-2021-12-14/
[14] https://www.rba.gov.au/media-releases/2022/mr-22-02.html
[15] https://www.apra.gov.au/consultation-on-zero-and-negative-interest-rates
[16] See footnote 15.
[17] https://www.apra.gov.au/operational-preparedness-for-zero-and-negative-interest-rates

 AUD
AUD
 Loading... Please wait...
